Data-driven business development
Background of the project
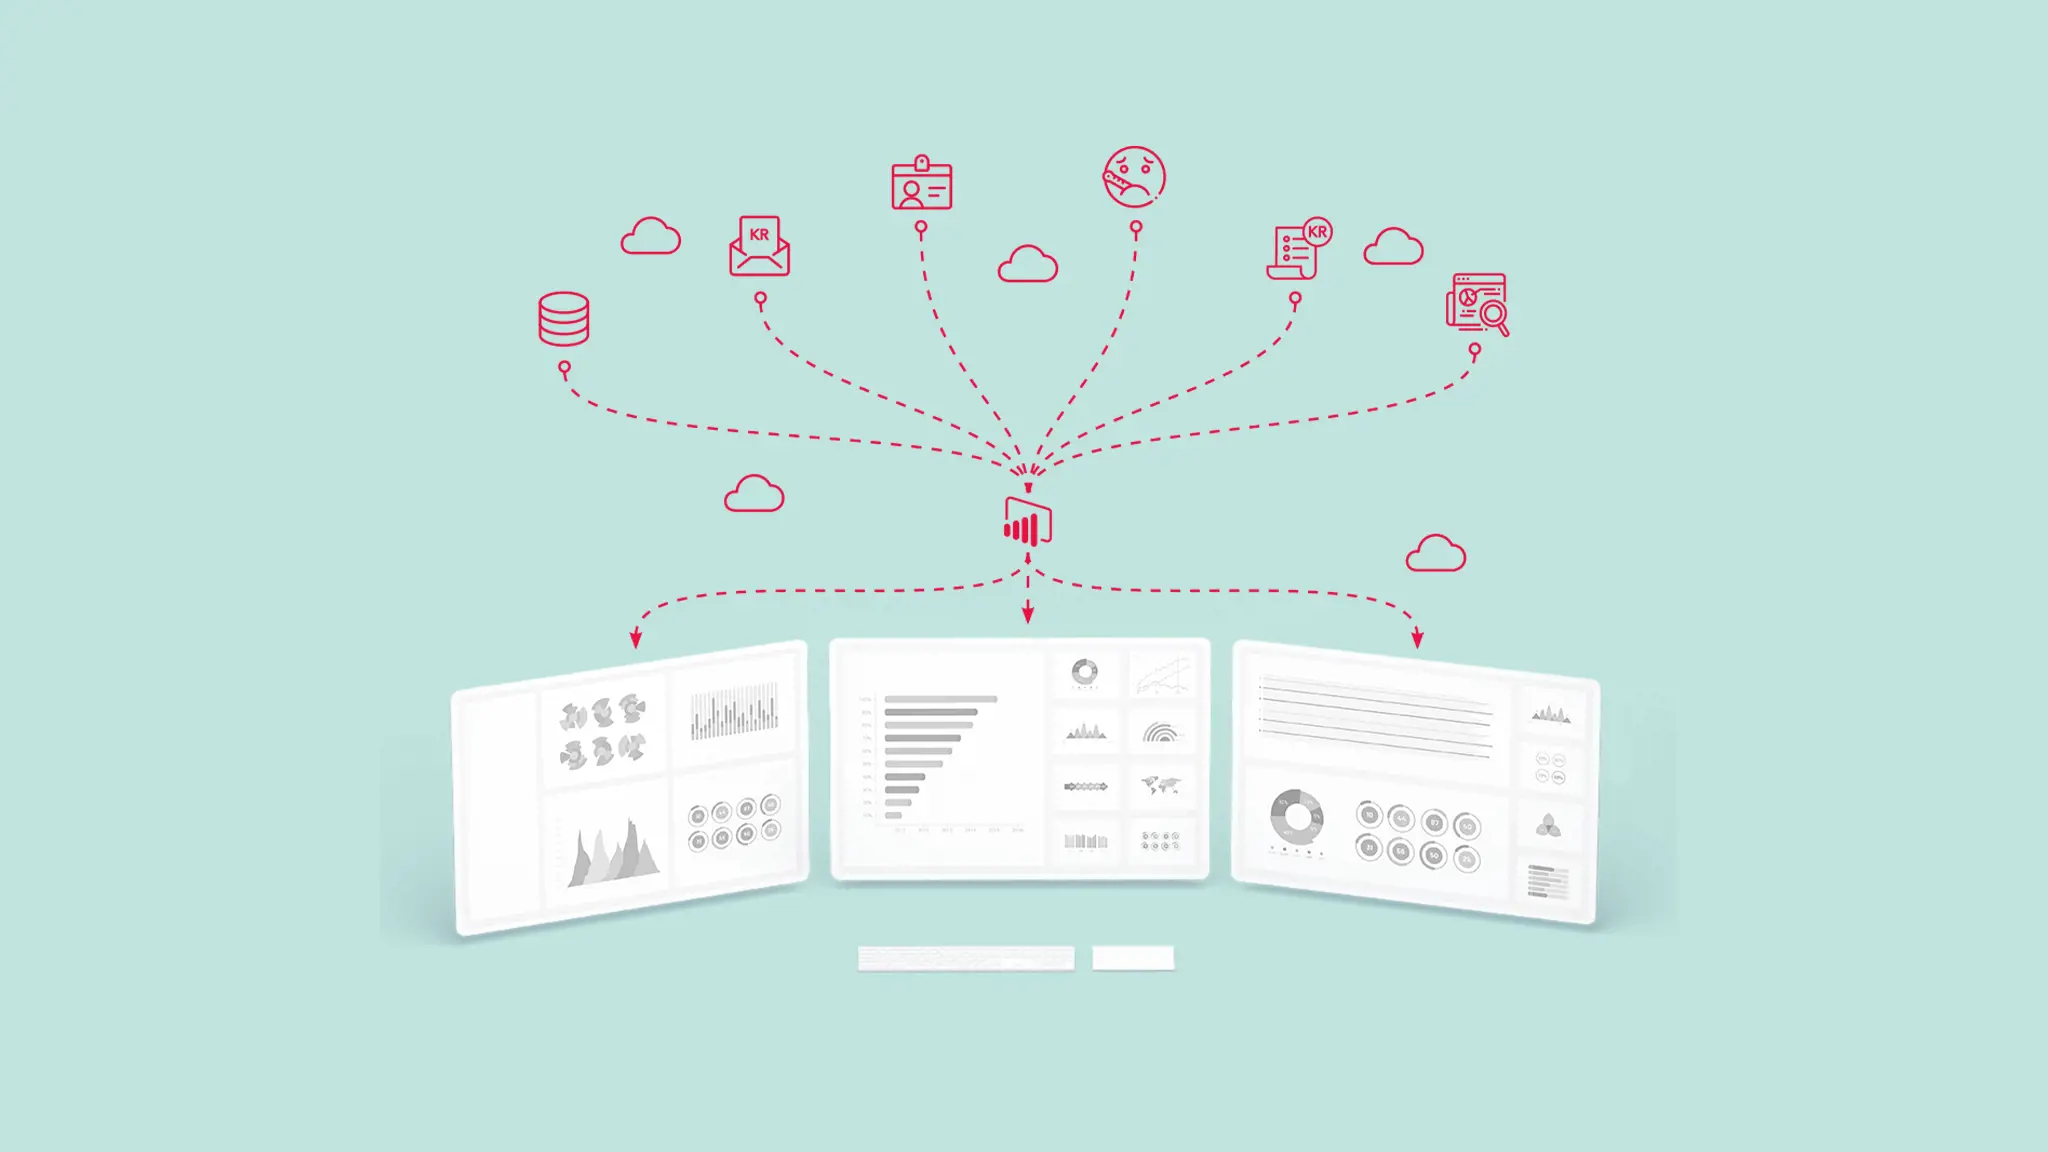
From 2018 to 2019, we faced a major growth challenge. It was a year-long journey to integrate all our data channels into one unified user platform. All data is stored in the cloud, and visualization tools illuminate our KPIs and relevant metrics at a glance across teams, departments, and countries. Real-time data insights enable daily navigation in operations and performance. Today, we make strategic decisions based on data-driven insights combined with experience and intuition. Data ignorance is no longer a barrier to untapped revenue potential; it has become a competitive advantage. The growth challenge has been solved at Novicell.
Read about how we did it here.
The Challenge: Consolidating Growth with Real-time Performance Data
The Problem: Needing Answers to Critical Operational Questions... Faster!
"In a time-tracking company, the business model is often different. Excess hours cannot be stored in inventory. Employees are our greatest asset, and employee performance is crucial to revenue. Therefore, daily visualizations of KPIs and metrics were vital for success.
In a growing company, success can blind one to the business-critical aspects, making it difficult to face the challenges head-on. That's why it was essential to create an overview to drive a financially healthy and secure business. We lacked the necessary visibility and control over how hours were spent before the month was closed and billed. Tangible insights into how excess or internal hours were utilized and how the billing rate could be increased were crucial for achieving higher revenue.
Several questions remained unanswered:
- "How much money are we 'losing' due to data ignorance?"
- "How can we optimize our skills to the fullest?"
- "What happens between hours sold and hours billed?"
- "Are we evaluating and communicating based on facts?"
- "Why are there so many internal tasks?"
There was untapped potential for increased growth due to a lack of visibility, control, and data ignorance. We had a specific desire to gain daily insights into operations and performance across teams, departments, and countries throughout the organization, in order to act and allocate hours in real-time, instead of being surprised once a month and playing catch-up.
The solution: The foundation for sound strategic decisions is data, intuition, and experience in harmony!
Today, we use our dashboards to:
- Monitor the influx of new customer cases to ensure we can provide them with the right resources and support from the beginning.
- Assess the capacity utilization of each team to determine if reallocation or additional resources are needed.
- Gain a comprehensive overview of the entire process from a sold hour to invoicing, enabling us to identify patterns and reasons for hour write-offs.
- Facilitate cross-team collaboration and knowledge sharing by identifying teams that excel in specific metrics.
- Establish a shared language and dataset for evaluating our business performance.
From Performance Overview to Performance Enhancement
Integrated data dashboards provide an overview but do not generate an increased billing rate without action. In our business, the overview became a catalyst for the goal of improved management within the organization and a foundation for alignment between the leader's expectations and employee performance on a daily basis. Based on our tailor-made data dashboards, Novicell's executive members have made the following statements:
We can react in real-time through automated dashboards and evaluate our performance based on the same data overview across teams, departments, and countries. Yesterday's critical key metrics for the company are served to me when I wake up. It makes a tremendous difference.
At its core, it's about getting the right information at the right time, which can then be translated into concrete actions in our everyday operations. Additionally, analyzing data has become significantly easier as we have all the information at our fingertips down to the smallest detail. Prior to implementing our data warehouse with integrated data dashboards, there was a substantial workload with a corresponding high risk of errors, as manual efforts were required to combine different data sources. Our easy access to data availability provides immense value to our company.


